ALFOSC spectroscopic flux-standard star monitoring
Setup:
- ALFOSC
- 10 arcsec slit (dont forget to update slitpos.def! Xpos = 1050)
(note that the automated pipe-line processing requires
that you use this slit!)
Instructions:
- pick a low-airmass star from the catalogue SPnnnnSnnn (see table below)
- tcs.guide-object-with-parallactic "SPnnnnSnnn"
- alfosc.acquisition Slit_10.0 0.2
- resetxy
- xsize 400
- xbeg 851
- put in the Slit_10.0
- put in Grism nr. 3, 4, 5, 6, 7, or 8, 14, 16, 17, 18, 19, 20
- expose (see table below for approximate exposure times)
-
check, using 'QuickSpec', that the peak counts are around 25000 - 60000
ADU or so
- no calibration frames are needed
| name | TCS catalog entry | spectral type | exp time |
|---|
| HD 19445 | SP0305+261 03:05:28.6 26:09:06 Mean 1950 -0.010 -0.830 | 8.0 | sdF (red) | 5 |
| He 3 | SP0644+375 06:44:14.8 37:35:03 Mean 1950 -0.010 -0.910 | 12.1 | DA (blue) | 150 |
| HD 84937 | SP0946+139 09:46:12.0 13:59:17 Mean 1950 +0.027 -0.790 | 8.3 | sdF (red) | 6 |
| Feige 34 | SP1036+433 10:36:41.0 43:21:49 Mean 1950 +0.000 +0.000 | 11.3 | sdO (blue) | 90 |
| HD 93521 | SP1045+378 10:48:23.5 37:34:13 Mean 2000 +0.000 +0.010 | 7.0 | O9Vp (blue) | 2 |
| BD+26 2606 | SP1446+259 14:46:50.2 25:54:53 Mean 1950 +0.000 -0.350 | 9.7 | sdF (red) | 25 |
| BD+33 2642 | SP1550+330 15:51:59.9 32:56:53 Mean 2000 | 10.7 | B2IVp (blue) | 60 |
| Wolf 1346 | SP2032+248 20:32:14.0 24:53:57 Mean 1950 -0.030 -0.550 | 11.6 | DA (blue) | 100 |
| BD+17 4708 | SP2209+178 22:09:05.8 17:50:42 Mean 1950 +0.036 +0.050 | 9.4 | sdF (red) | 15 |
| Feige 110 | SP2317-054 23:19:58.4 -05:09:57 Mean 2000 | 11.9 | DOp (blue) | 150 |
Click on the
objects, or check
the ING pages for more information on these flux-standard stars,
such as finding charts.
The visibility plot of today: 
Data analysis
Please analyse the data using the automated interactive procedure on
elena:
The script doitall.script calls an IRAF host script called
doitall.ihs, which opens an Xgterm and interactively guides you
through the reduction: read the instructions that it displays. For
successful completion of the script only 6 keystrokes in 'splot' are
necessary.
Results
Once you have analysed the data, hit 'reload' and have a look below.
Database ASCII table
PS file 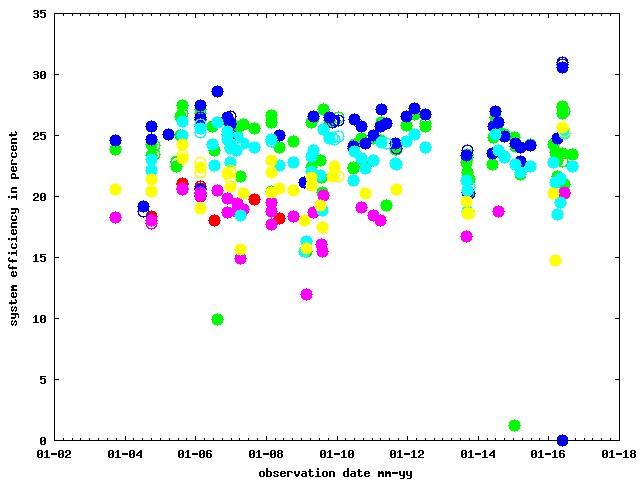
Above: Grism photometry: the mean system efficiency in a
wavelength interval of 500 Angstroms.
This interval is 490-540nm for grisms 3
(red), 4 (green), 6 (pink), 7
(cyan),
and is 600-650nm for grisms 5
(blue) and 8 (yellow) .
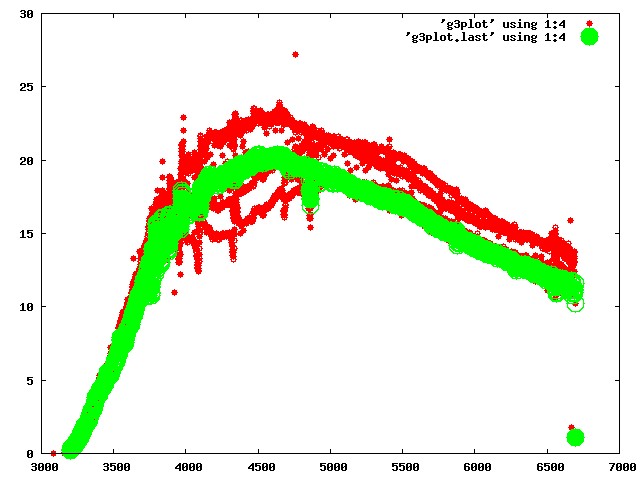
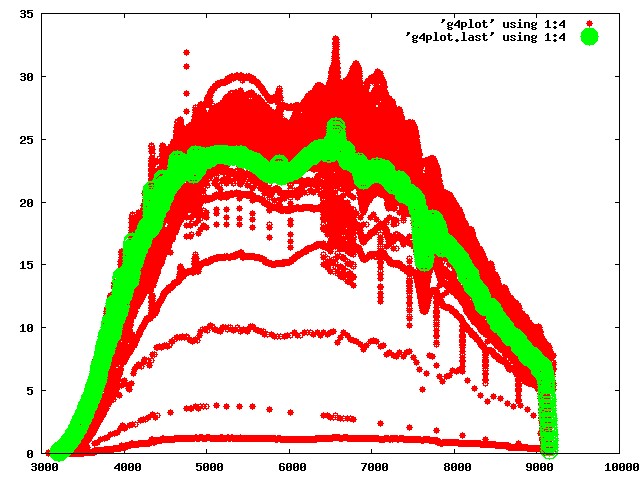
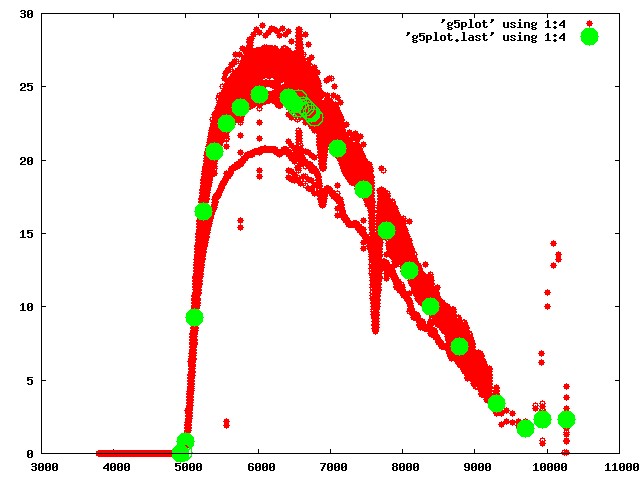
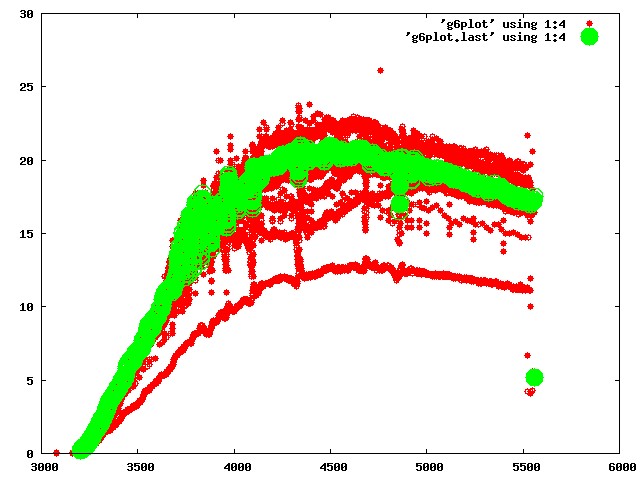
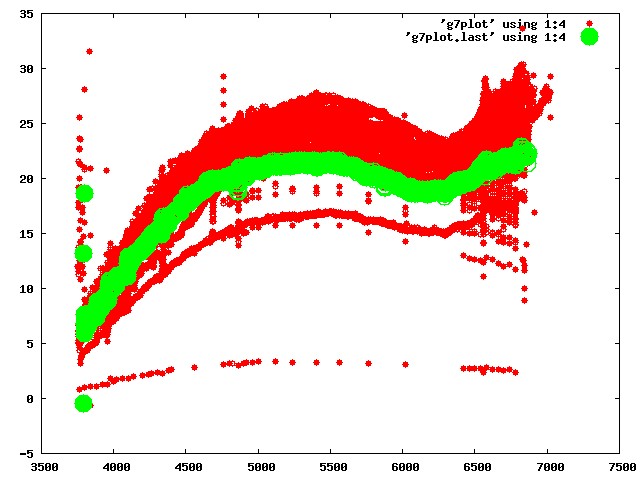
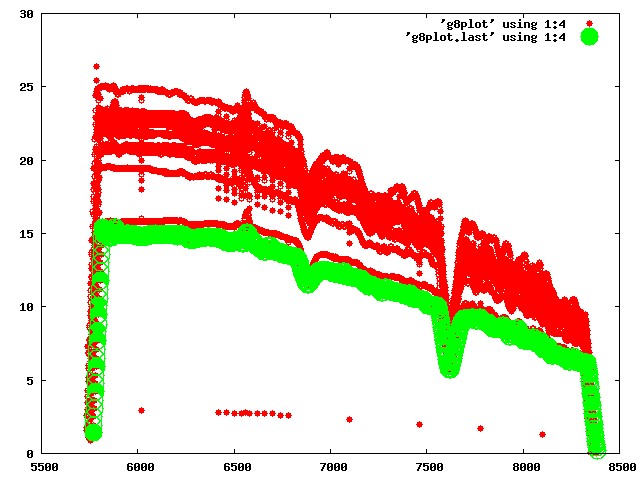
Below: All previous data in red, with the last spectrum in green.
|