![]()
![]()
![]()
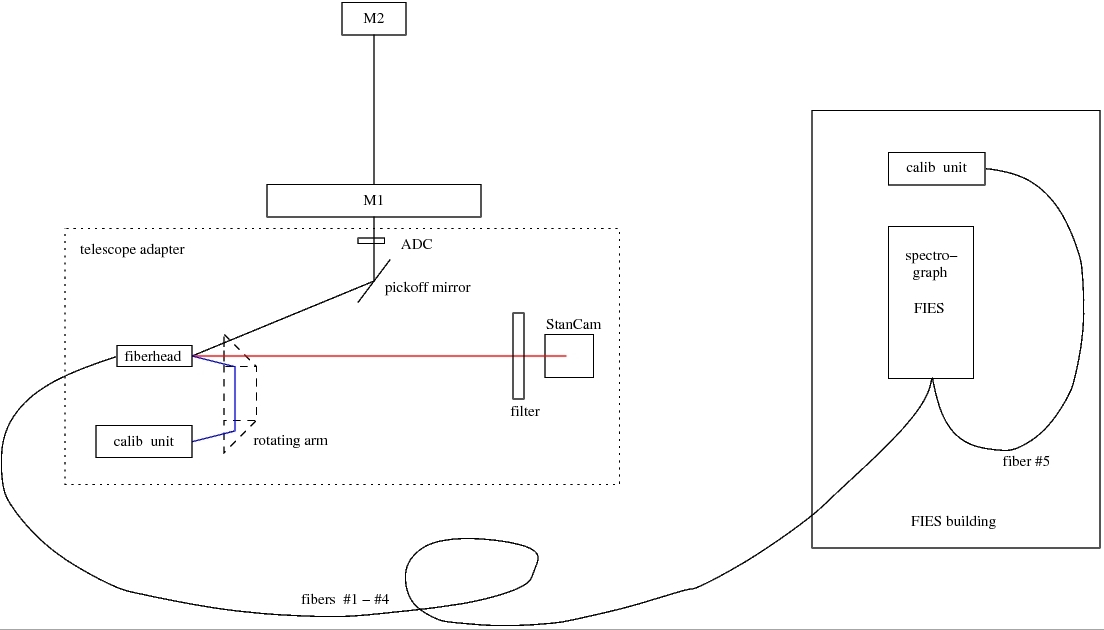
Commissioning of FIES in its new locationAround the change of year 2005/2006 the high-resolution FIbre-fed Echelle Spectrograph (FIES) was moved from the observing floor to a dedicated building next to the telescope. This new location provides a stable environment to enable high-accuracy measurements to be obtained with FIES.This page is targeted at (potential) users of FIES, and provides the current status of the development and commissioning of FIES in its new environment. Papers describing FIES FIES lightpath overview Detector Spectrograph Fiber units Calibration units Wavelengths, dispersion, etc. Efficiency Inter-order distances and PSF Fringes Wavelength zero-point stability Shutter limitations Exposure meter ADC Simultaneous-sky mode Modal noise Fiber shaker Technical papers describing FIESThe FIES spectrograph report to STC (Lindberg & Frandsen, Sept 1998)FIES technical report (Lindberg, Lens-Tech, Skellefteaa, Sept 1998) CCD13 pre-commissioning report (A. Sørensen, 2003) Design of the the Fiber bundles B and C (Lindberg, 2011) FIES lightpath overviewThe light from the telescope is picked off in the telescope adapter by an approximately 45 degree mirror that can be moved into the telescope beam at any time. The light from the sky is imaged onto small adjacent mirrors on the fiberhead. Each mirror has a central hole, behind which a fibre is located. The fibres are running from the telescope adapter to the spectrograph: one 200 micron fibre (low-res), and three 100 micron fibres (med-res sky, med-res and high-res).For target acquisition the standby imager StanCam is used. The light reflected from the small mirrors of the fibrehead is imaged onto StanCam, to allow the telescope to be tweaked until the target is centered onto one of the fibres. As of 2010 the atmospheric dispersion corrector (ADC) is installed under the 'roof' of the telescope adapter, and can be swung into the telescope lightpath before the pickoff mirror.
Detector characteristics: FIES spectrographThe Echelle spectrograph itself is described in detail in documents that can be found on the NOT web pages.The FIES spectrograph report to STC (Lindberg & Frandsen, Sept 1998) FIES technical report (Lindberg, Lens-Tech, Skellefteaa, Sept 1998) FIES: a high resolution FIber fed Echelle Spectrograph for NOT (Frandsen & Lindberg, in Astrophysics with the NOT, 1999) FIES: The high-resolution Fiber-fed Echelle Spectrograph at the Nordic Optical Telescope (Telting et al. 2014, AN335, 41) The Echelle orders run vertically on the CCD, and in the blue region they are sufficiently far apart to allow for an interlaced calibration spectrum (ThAr or sky) to be recorded simultaneously (see below for details). The spectrograph allows a fixed wavelength setting only. Except for the focus drive and spectrograph shutter there are no motorised moving parts in the spectrograph. The spectrograph can be focused with the computer-operated focus drive, which moves some of the optics in the spectrograph camera towards or away from the CCD. The spectrograph shutter is operated by the CCD controller, and sits at the entrance of the spectrograph just behind the fibres.
Focussing the spectrograph:
Design of the
the Fiber bundles B and C (Lindberg, 2011)
Spare bundle B
Additionally there is a separate high-res calibration fibre for the
simultaneous ThAr mode. This fibre can be used in combination with target
fibres Fib3 (med-res) or Fib4 (high-res).
Below the first bundle is described; most things apply to the newer
bundles as well. However, with bundle B one cannot obtain a simultaneous
sky spectrum as Fib2 does not exist.
Old bundle A (decommissioned)
At the telescope end, the starlight is imaged onto the target
acquisition mirrors, which have circular apertures of about 3.3 arcsec
and 1.5 arcsec diameter for the 200 and 100-micron fibres
respectively. The telescope pupil is imaged onto the fibre entrance
by means of a spherical microlense which sits directly behind the
aperture.
Fibres are selected using a sliding mask which opens access to
either one fibre or two adjacent fibres.
At the spectrograph the 4 fibres end in a line, with a fifth fibre
that comes from a calibration unit located in the spectrograph room.
This fifth fibre allows for simultaneous ThAr spectra to be recorded.
The echellograms produced by each of the fibres are slightly shifted
in the cross-dispersion direction.
At the fibre exit, the high-res and the calibration fibre are equipped
with a slit of 50 micron width, which is needed to reach a spectral
resolution of R~67000. The slit losses are approximately 40%. The
light of all 5 fibres passes a focal extender that narrows the beam
into the spectrograph to limit the grating-overfill losses due to
focal-ratio degradation in the fibres. The lens multiplies the Fratio
by a factor 1.76, resulting in a beam of approximately F/7.5 going
towards the collimator.
Calibration unitsThe fifth fibre connects to a calibration unit housing 4 or 5 lamps, of which usually only a halogen and a ThoriumArgon are used. The latter is used for the 'simultaneous ThAr mode', in which an interlaced ThAr spectrum can be recorded while exposing on-sky. The halogen lamp is used to define and trace the orders of the Echellogram of the fifth fibre.
A second calibration unit is located in the telescope adapter, which
calibrates the science fibres. A rotating arm, that transmits light
from either a halogen or a ThAr lamp, can be located infront of one of
the science fibres at the time. When the arm is infront of a fibre,
the light from the telescope is blocked.
Due to the way the fibres are mounted at the spectrograph entrance the
Echellograms of each of the fibres are a bit shifted with respect to
eachother in the cross-dispersion direction (X direction of the
CCD). At the red end the CCD cuts off the most orders for the low-res
fibre and the least for the high-res fibre: see the wavelength range
in the table below.
The spectral resolution is taken from the FWHM of arc lines at the
blaze, and can be slightly lower at the extremes of the orders. Note
that the lamp light does not have a central obscuration as the
telescope has; in case of incomplete radial scrambling in the 40
meter long fibres, the spectral resolution for starlight might be
somewhat lower than for lamp light.
For bundle C, we find similar values as in the above tables.
A list of order numbers and
wavelength ranges per order and dispersions per pixel can
be found here . Note that the CCD is too small
to sample all the listed orders together. Order overlap is achieved
below 7200 Angstrom.
System efficiencyThe plot below shows two measurements made at different nights, for a very blue and a very red wavelength setting. These settings were chosen to check the system efficiency throughout the optical domain. The 200-micron low-res fibre was used, as this fibre suffers the least from seeing losses and losses due to atmospheric dispersion.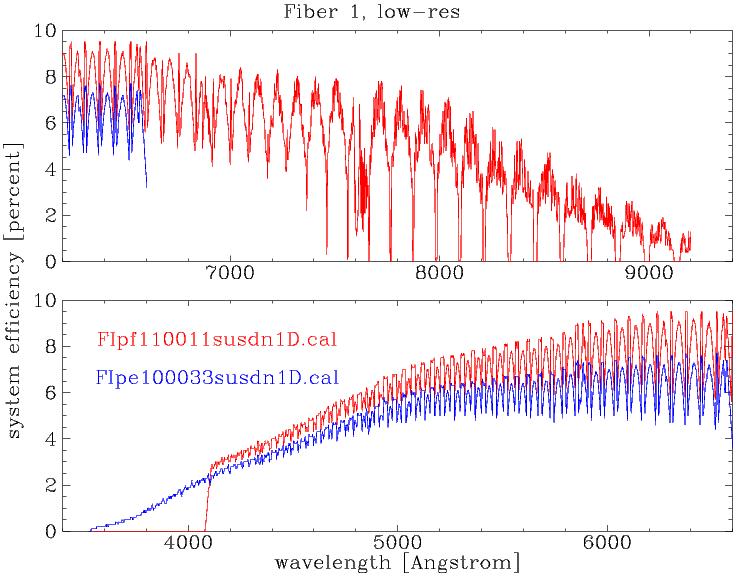 The system efficiency includes the full light path: atmosphere, telescope, fibres, spectrograph and the detector. For the low-res fibre the system efficiency at the blaze peaks at about 9% in the R band. In regions where there is order overlap, the combined efficiency peaks at about 9.5%. The 100-micron fibres suffer from seeing and atmospheric dispersion losses. If not using the ADC, it is important to center the star on the fibres using a colour filter in the beam to the target acuisition camera (StanCam) to minimise the atmospheric dispersion losses in the wavelength region of interest.
For the different fibres the echellogram is shifted in X position.
For each fibre the X-position at two wavelengths is indicated in the
table below, which allows to estimate the shifts between the echellogram
of two particular fibres.
Spare bundle B: for simultaneous ThAr observing mode, the calibration
fibre #5 can be used in combination with either the high-res fibre #4
or the med-res fibre #3. As the red light of the simultaneous ThAr is
filtered away, both cases will give sufficient distance between the
interlaced orders over the full wavelength domain.
Default bundle C: this bundle allows simultaneous-ThAr mode for Fib3
and Fib4, and simultaneous-sky mode for Fib3 (target) + Fib2 (sky).
Inter-order distances are very similar to those of the previous
bundles. At approximately 6300Å the sky spectrum starts to get
close to the target spectrum of the neighboring order.
FringesThe current E2V CCD42-40 detector fringes quite substantially. In flatfields the fringes become noticable from 6100 Angstrom, and reach 15% peak-to-peak amplitude at 7200 Angstrom (for all fibres).From test setups we know that the fringe amplitudes increase dramatically further towards the IR, but the current wavelength setting does not feature such very large fringe amplitudes. Wavelength zero-point accuracyScientific analyses of stellar spectra obtained during a single night or during a few-night run, point at the following achievable wavelength/velocity zero-point accuracy:
Results show that for a series of blue-sky spectra (i.e. the solar spectrum) with 10000 e- peak flux in simultaneous-ThAr mode, with exposure time 15 seconds, a wavelength zero-point accuracy of better than 4 m/s can be achieved within a single day. We expect that the same holds for well-illuminated stellar spectra.
From a sequence of ThAr spectra taken during a continuous 28 hours
(6/10/2008), we have been able to measure the Echellogram shift due to
atmospheric air-pressure variations. The ThAr spectrum shifts by
aproximately 120 m/s per millibar (HPa). Note that the diurnal
atmospheric pressure 'tide' amounts to about 1 Hpa peak-to-peak
amplitude. When using simultaneous-ThAr mode this air-pressure effect
is largely calibrated out.
Another recent result from scientific analysis: the RMS/sqrt(#lines)
of the wavelength solution decreases by almost 40% when going from a
5s to 20s ThAr (med-res fiber, bundle B). Apparently the penalty from
saturation and diffraction of the strong lines is less than the what
is gained from making the forest of weaker lines stronger.
For the high-res fiber F4 in Bundle C the RV accuracy does not differ
that much from Bundle B. Intra-night radial-velocity accuracy of
5-10 m/s has been observed regularly, regardless of the atmospheric
conditions.
Tests with the fiber shaker show that in cases of unstable seeing the
poor radial-velocity accuracy of the medium-resolution fiber F3 in
bundle C can be minimised. When shaking the fiber, the
radial-velocity accuracy achieved is close to that in stable seeing
conditions, and better than 10m/s.
The exposure meterSince fall 2008, FIES is equiped with an exposure meter that can be used to monitor the count rates during an ongoing exposure. The exposure meter picks off light inside the spectrograph that otherwise would have fallen outside the bottom of the CCD. As the red orders are longer than the blue orders, and hence more red light is falling off the CCD, the exposure meter is more sensitive for red stars than for blue stars.The exposure meter is placed under a small pickoff prism that intercepts part of the beam at the intermediate focal plane inside the spectrograph, after the light has been dispersed by the echelle grating, but before cross-dispersion. The placement of the pickoff prism is such that no photons are lost from the part of the echellogram that is sampled by the 2kx2k CCD. Below the pickoff mirror is a shutter that can be closed to protect the photomultiplier. The shutter will open when doing a non-dark exposure on the exposure meter. The Hamamatsu H8259-01 photomultiplier is continuously providing counts to an external counter that is placed in the front room. The photomultiplier is sensitive over the full FIES range, peaking between 300-600nm. The external counter can be undestructively read out every 3-4 seconds. The accumulated counts are written to the FIES status database by the FIES computer. The status program FIESTA is providing a graphical history of the exposure meter counts based on the accumulated count in the FIES status database. The dark current of the exposure meter is on the order of 150 counts per second, and has not been accounted for in the below table.
We have calibrated the exposure meter for fibre bundle B:
Additionally we have to calibrate
the absolute count rates for stars of different brightness.
The ADC consist of a set of rotating prisms, that when positioned
adequately can fully correct for up to approximately AM=3 . The ADC
provides an unvignetted FOV of 3.1 arcmin diameter, and hence can be
used for ALFOSC/NOTCAM on-axis spectroscopy as well.
When the ADC is in the beam, the telescope focus needs an offset of
about 560 units.
When in the beam, the ADC support arm will obscure some of the FOV of
the autoguider. This needs to be sorted out. It is expected that the
ADC obscures the top-lft part of the U-shaped guide field.
When using the ADC, note that the guide star is not corrected by the
ADC. This means that gradually the target will move away from its
initial position, if the ADC is used in 'continuous mode'. This may
result in object shifts of about 1 arcsec in half an hour of guiding.
Hence caution is required when using the 'continuous mode', and for
many applications the mode 'automatic-at-preset' should be considered
instead.
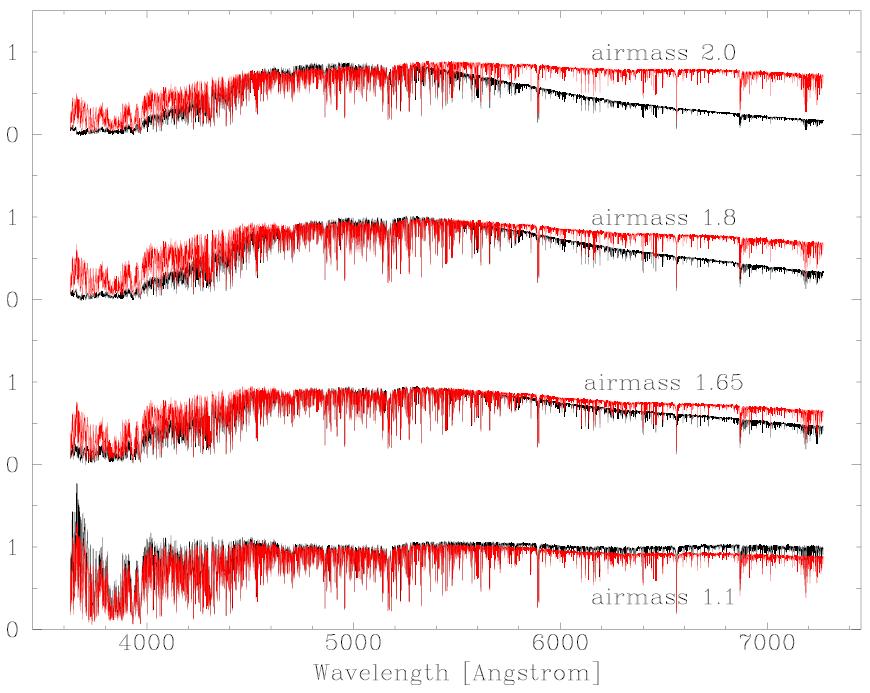
Below some first results of using FIES with the med-res fiber F3, with
and without the ADC, for different airmasses. Red-drawn spectra are
taken with the ADC. All spectra are normalised to the (black) AM=1.1
spectrum taken without ADC. The spectra were obtained with the
B-filter infront of the fiber-viewing camera. For AM>1.5 (or so)
factors of 3-4 can be won at the extremes of the FIES wavelength
coverage, when using the ADC.
It was also found that the ADC is beneficial for accurate RV
measurements at high airmass. Without ADC the RV varies parabolically
as a function of echelle order, whereas this effect is much smaller
when using the ADC.
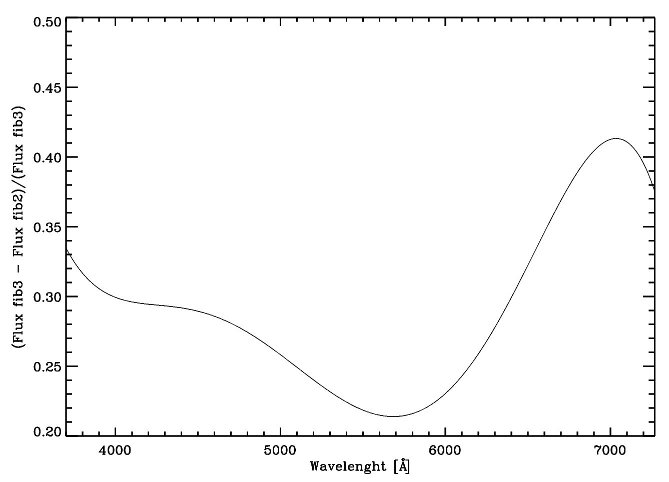
Simultaneous sky modeIn 2010 the possibility of making simultaneous observations of a target star and the sky background was investigated using fiber 2 and 3 (both medium resolution) in fiber bundle C. Tests were made using blue-sky spectra.
A throughput comparsion between fiber 2 and fiber 3 has been made and
shows the science fiber (fiber 3) to be 41% more efficient than fiber 2,
in mean. A polynomial fit to the difference is shown below.
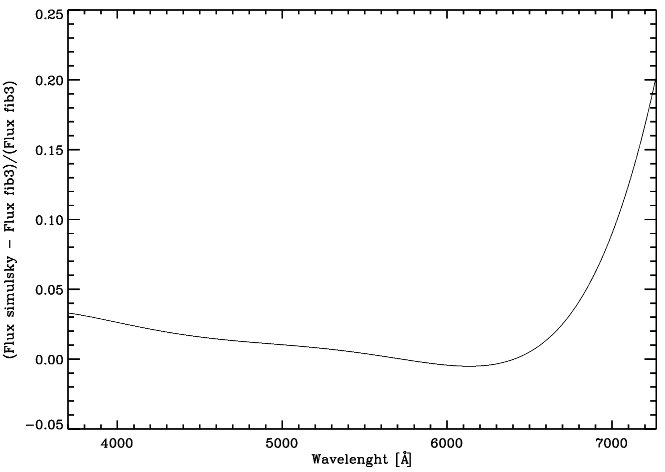
When using the instrument in simultaneous sky mode the inter-order distance
between the sky spectrum and the science spectrum decreases towards the red,
causing problems with scattered light substraction when FIEStool is used for
the reduction. Below is shown the difference between a spectrum taken with
fiber 3 and a spectrum taken in simultaneous sky mode. At a wavelenght of
6700AA the difference between the two spectra is larger than 2.5% with
increasing discrepancy towards the red.
Calibration frames can be obtained individually for the two fibers (F2
and F3) so two sets of flats and wavelength-definition frames should be
made (in the afternoon).
Also a set of two wavelength-calibration frames (one for each fiber F2
and F3) should be made everytime an update of the wavelength solution
is required, to get accurate wavelengths for both the sky spectrum and
the science spectrum.
To calibrate the throughput difference of the two fibers a set of
blue-sky exposures should be made before sunset in an ABBA sequence
(in this case F2 --> F3 --> F3 --> F2) to average out the effect of
the changing light level, when merging the frames. Exposure times of
20 seconds are appropriate for this. Make sure the telescope is
pointing AWAY from the Sun before opening the dome. Note that the
dome-lights used for dome flats doesn't provide sufficient
illumination for this calibration.
Such modal noise will not flat-field out, as due to the fiber movements
invoked by the telescope, the flatfield will change as a function of
time as well.
Modal noise is a symptom of non-perfect scrambling of the light in the
fibers, and it may be possible that the RV-stability problem of bundle
C is another symptom of this. A possible solution to cure the modal
noise is a fiber shaker, which may also improve the general scrambling
characteristics of the fibers in bundle C.
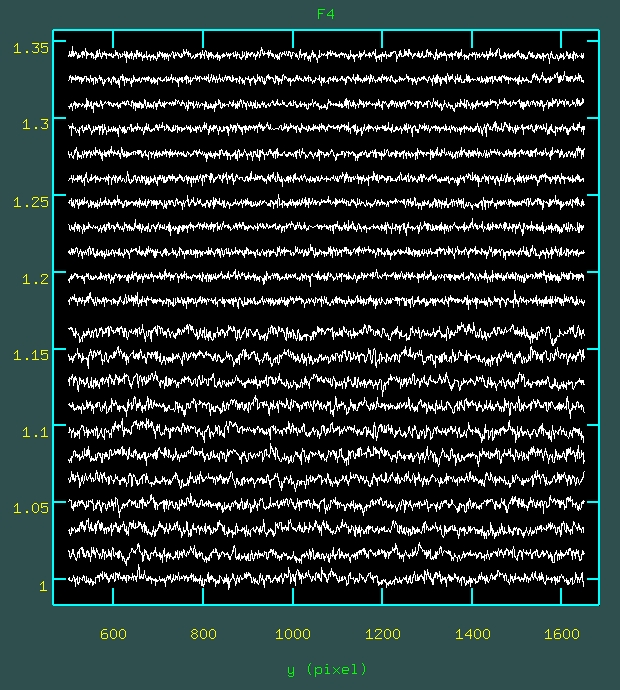
For fiber 4 each of the 2 sets of 21 flats were combined into a
bias-subtracted masterflat. The masterflats corresponding to before
and after fiber repositioning were then divided into each other, and
the S/N was derived from these quotient flats, in 11 orders covering
the wavelength region of 500-560nm. The 11 orders of the quotient
flats are displayed at the bottom half of the below figure.
As can be judged from the figure, the bottom set of orders shows much
more irregularity as a function of wavelength than the top set,
whereas based on photon statistics the opposite would be expected. In
fact the irregularities seem to spread over broader regions than that
oridinary photon noise does.
As can be seen from the difference between expected and measured S/N,
the repositioning of the fiber has a major influence on the results.
This, especially in the case of Fiber 4 which has an exit slit to
enhance the spectral resolution. The large effect for this fiber may
be because of the exit slit, which provides an extra plane of
vignetting, or may be by chance because of the way the repositioning
of the fiber on the dome-floor was done.
It is clear that modal noise induced by fiber movements is severely
limiting the maximum S/N that can be reached in FIES spectra. It
remains to be checked if the other fiber bundle is affected similarly
by modal noise.
The fiber shakerThe new fibre bundle C for FIES gave improved throughput and a working sky fibre. Unexpectedly, however, the accuracy of radial-velocity measurements with the medium-resolution fibre degraded considerably when observing in unstable seeing conditions. Several remedies were tested, but without decisive success. One possibility was that a variable nonuniform illumination might propagate from the fibre entrance to the exit, but might be averaged out by moving a section of the fibre slightly, but frequently during the integration.As a test, an interim fibre shaker or scrambler to move the fibre cable a few cm every couple of seconds was built from LEGO building blocks, motors and controllers, courtesy of Felix Telting. As the test was very promising, a more permanent prototype was acquired for further testing. The new fiber shaker is installed after the part of the fibers that are moved by the telescope, about 10 meters away from the spectrograph. The shaker translates the fiber bundle transversely in the horizontal plane, with a stroke of several cm and a frequency of a few Hz. The frequency can be chosen. Photographs of the shaker can be found here.
Tests with the fiber shaker show that in cases of unstable seeing the
poor radial-velocity accuracy of the medium-resolution fiber F3 in
bundle C can be minimised. When shaking the fiber, the
radial-velocity accuracy achieved is close to that in stable seeing
conditions, and better than 10m/s. Tests with the shaker aimed at improving the modal noise (see above) did not show any positive effect. The fiber-shaker is currently not offered to the community.
John Telting | |||||||||||||||||||||||||||||||||||||||||||||||||||||||||||||||||||||||||||||||||||||||||||||||||||||||||||||||||||||||||||||||||||||||||||||||||||||||||||||||||||||||||||||||||||||||||||||||||||||||||||||||||||||||||||||||||||||||||||||||||||||